Enrich your reporting with interactive Data Stories
See it working
A real, published Timepath story — embedded exactly the way you would embed it.
Data Story. Data-driven narratives with engaging charts.
Loved by leading newsrooms worldwide
Join the ranks of top newsrooms leveraging Timepath to enhance their storytelling and audience engagement.
- De Telegraaf
- Luxemburger Wort
- Leeuwarder Courant
- de Volkskrant
- Het Parool
- De Morgen
- RTL Nieuws
- Margriet
- LINDA
- Libelle
- Belfast Telegraph
- Irish Independent
- NU.nl
- Aachener Zeitung
- Pageview stories
- 1 billion+
- Newsrooms
- 50+
- Time saved
- 25%+
Create. Publish. No design team needed.
Making a Timepath Data Story is simple and effortless. Your newsroom can create interactive visuals without coding or design skills. Boost your workflow and bring data to life in minutes.
Top features for effortless data visualization
Discover how you can save time on visualization and focus on reporting the story that matters.
Streamline your workflow
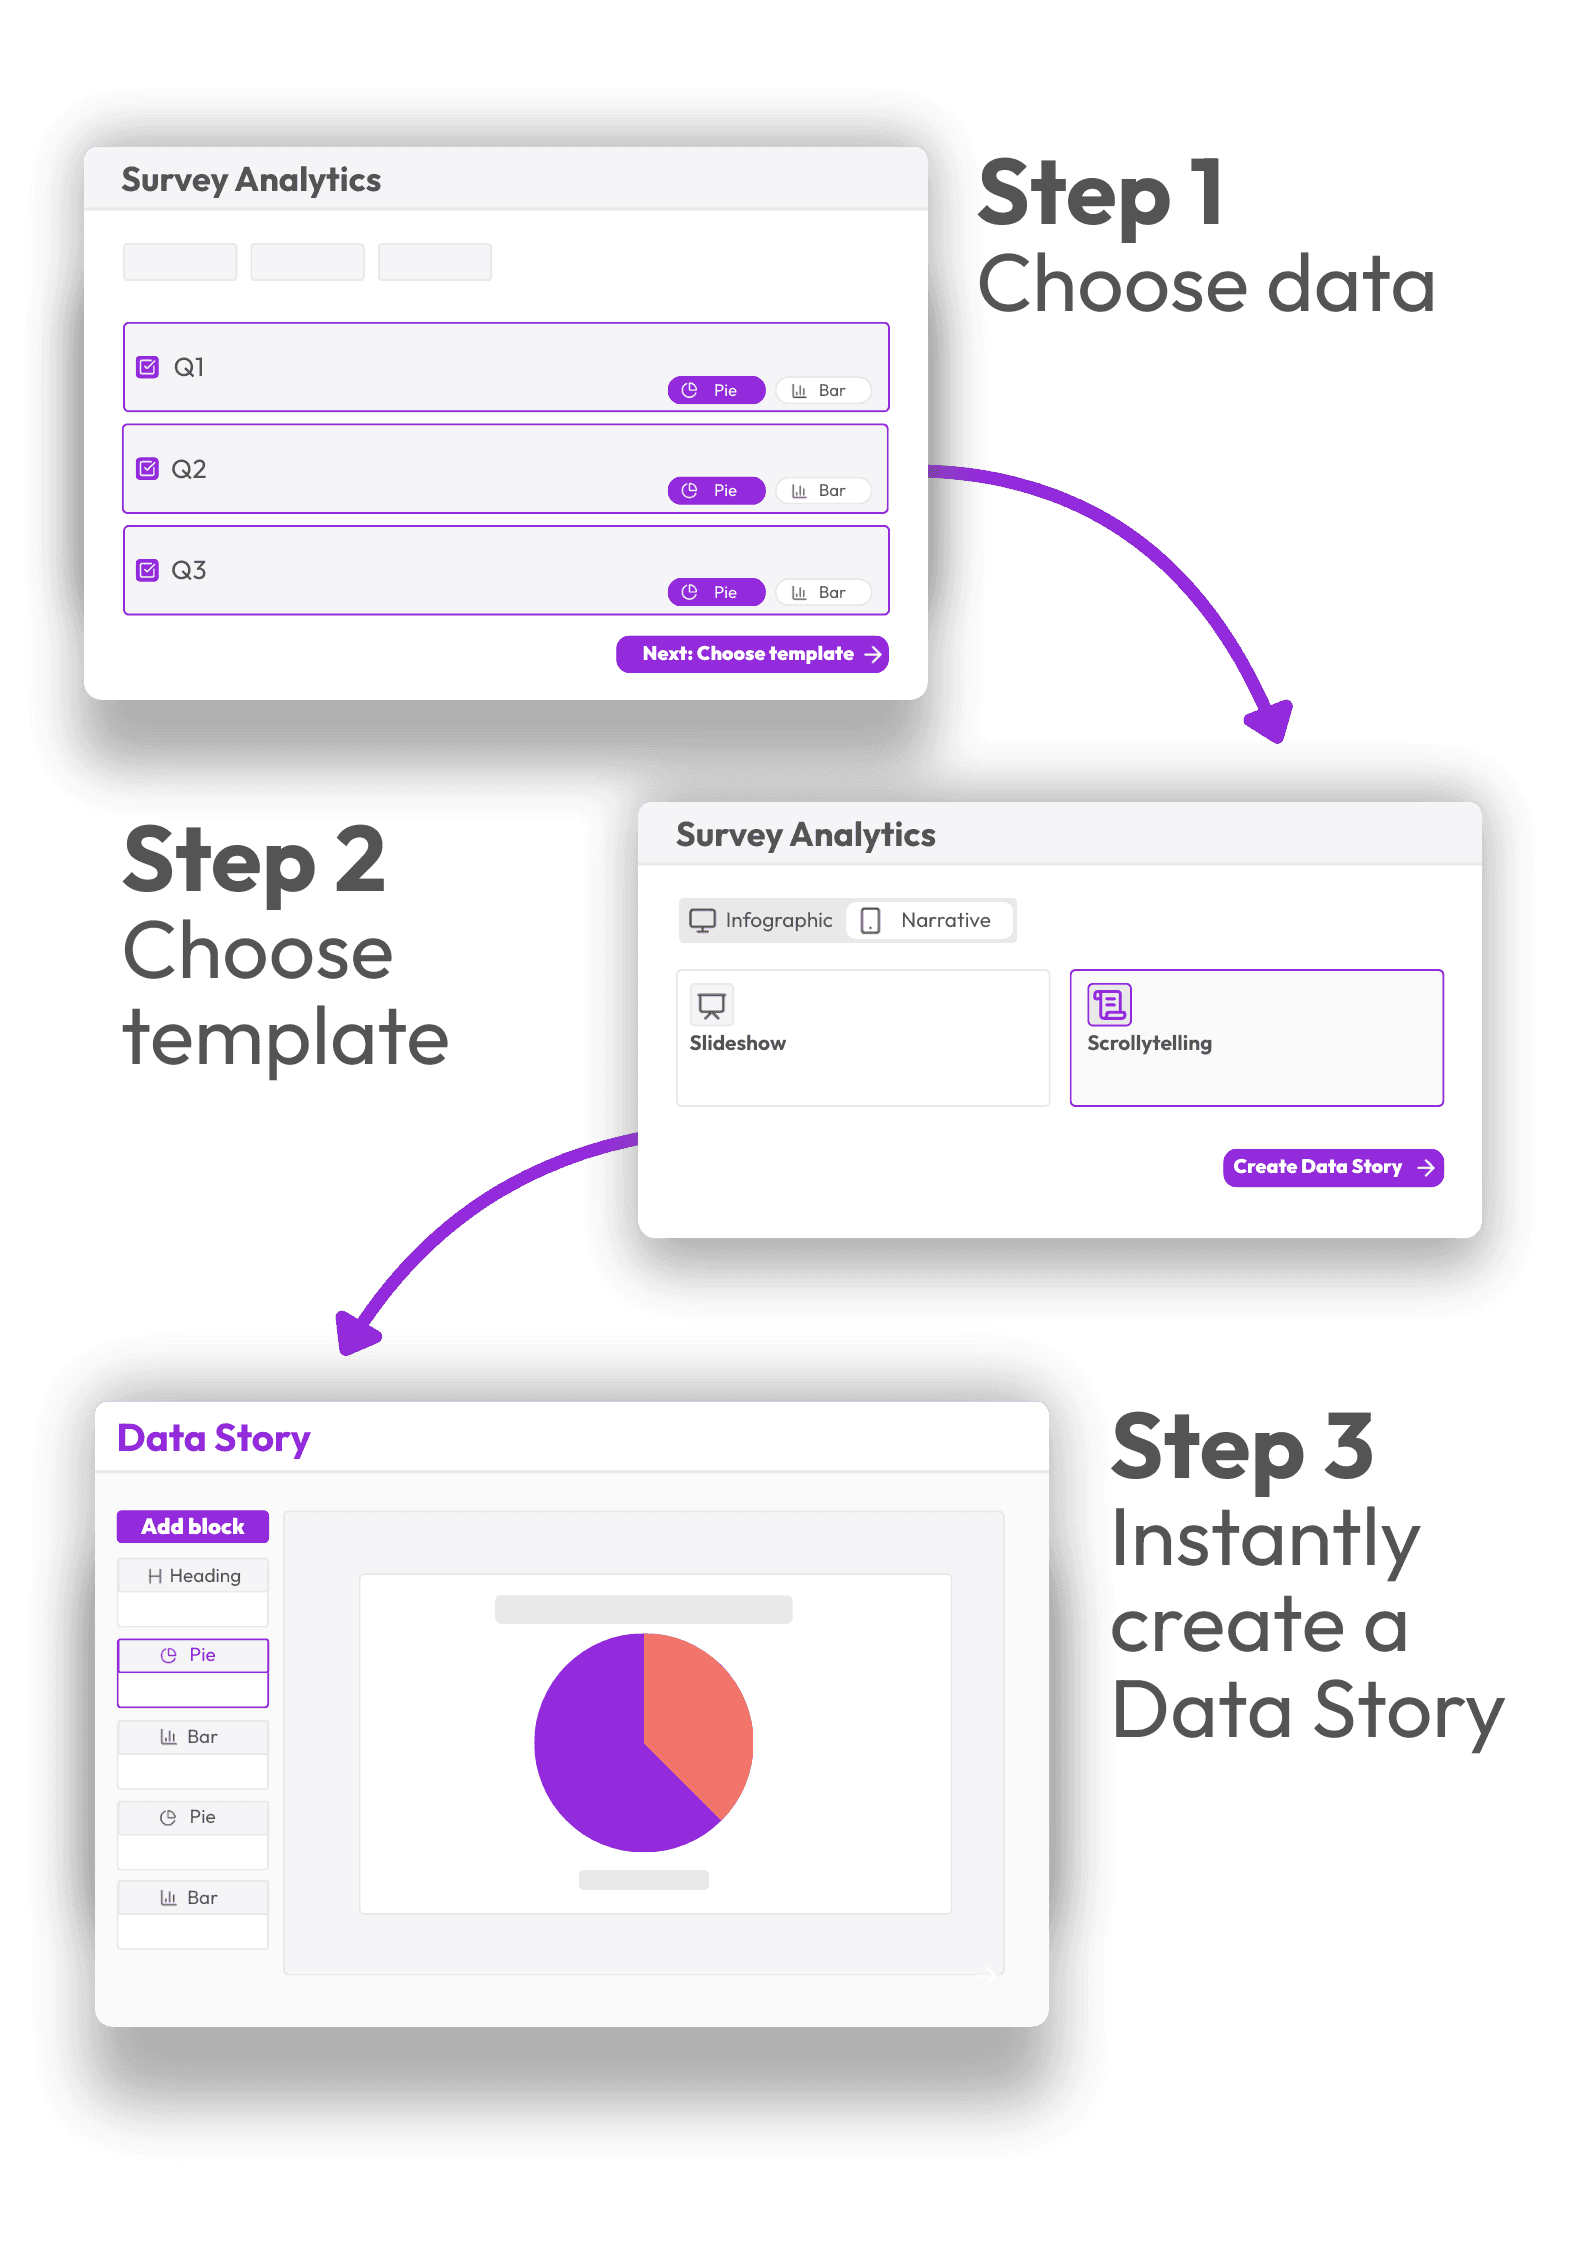
Seamlessly pull your data directly from Timepath Survey without exporting or formatting. Everything is ready to visualize instantly. Save time and keep your workflow smooth while creating interactive data stories.
RTL Nieuws
“As the chief editor of RTL Nieuws, I can confidently say that with Timepath liveblogging, we're able to provide real-time updates to our readers as events unfold, keeping them informed and engaged like never before.”
DPG Media
“Timepath timeline maker meets a need we already had: a tool that allows you to quickly and user-friendly create beautiful, clear timelines. Timelines lead to an increase in the engagement rate, and visitors spend more time reading our articles.”
Frequently Asked Questions
From timelines and liveblogs to quizzes, polls, and collections, find answers to the most common questions about creating, customizing, and publishing interactive content with Timepath.
Go to our FAQ pageWhat is Timepath Data Story?
Timepath Data Story is an interactive tool built for journalists. Quickly create and deploy interactive data visuals that integrate seamlessly into your articles. This process lets journalists turn complex data into interactive, evidence-based stories that engage readers and build trust.
Can I use the data from my Timepath Survey results?
Yes! Timepath Data Story and Timepath Survey are designed to work hand-in-hand to boost workflow. Once you have your survey results, you can export the data directly into a data story, creating visuals instantly, such as statistics, pie charts, and quotes from your open questions.
What visualization options do I have with Timepath Data Story?
With Timepath Data Story, you have a wide variety of data visualization options. You can choose from charts, stat blocks, images, videos, quotes from open responses, headers, and text — all seamlessly integrated. Plus, our pre-made templates let you build interactive infographics, scrollable stories, or swipeable narratives, so you can create polished, engaging visuals quickly and easily.