Enrich your reporting with interactive Data Stories








See it working
A real, published Timepath story — embedded exactly the way you would embed it.
Visualize & explore
Ten products, one editor, one analytics layer.
Explore the suiteTrusted by industry leaders
Loved by leading newsrooms worldwide
Join the ranks of top newsrooms leveraging Timepath to enhance their storytelling and audience engagement.
- Pageview stories
- 1 billion+
- Newsrooms
- 50+
- Time saved
- 25%+



Create. Publish. No design team needed.
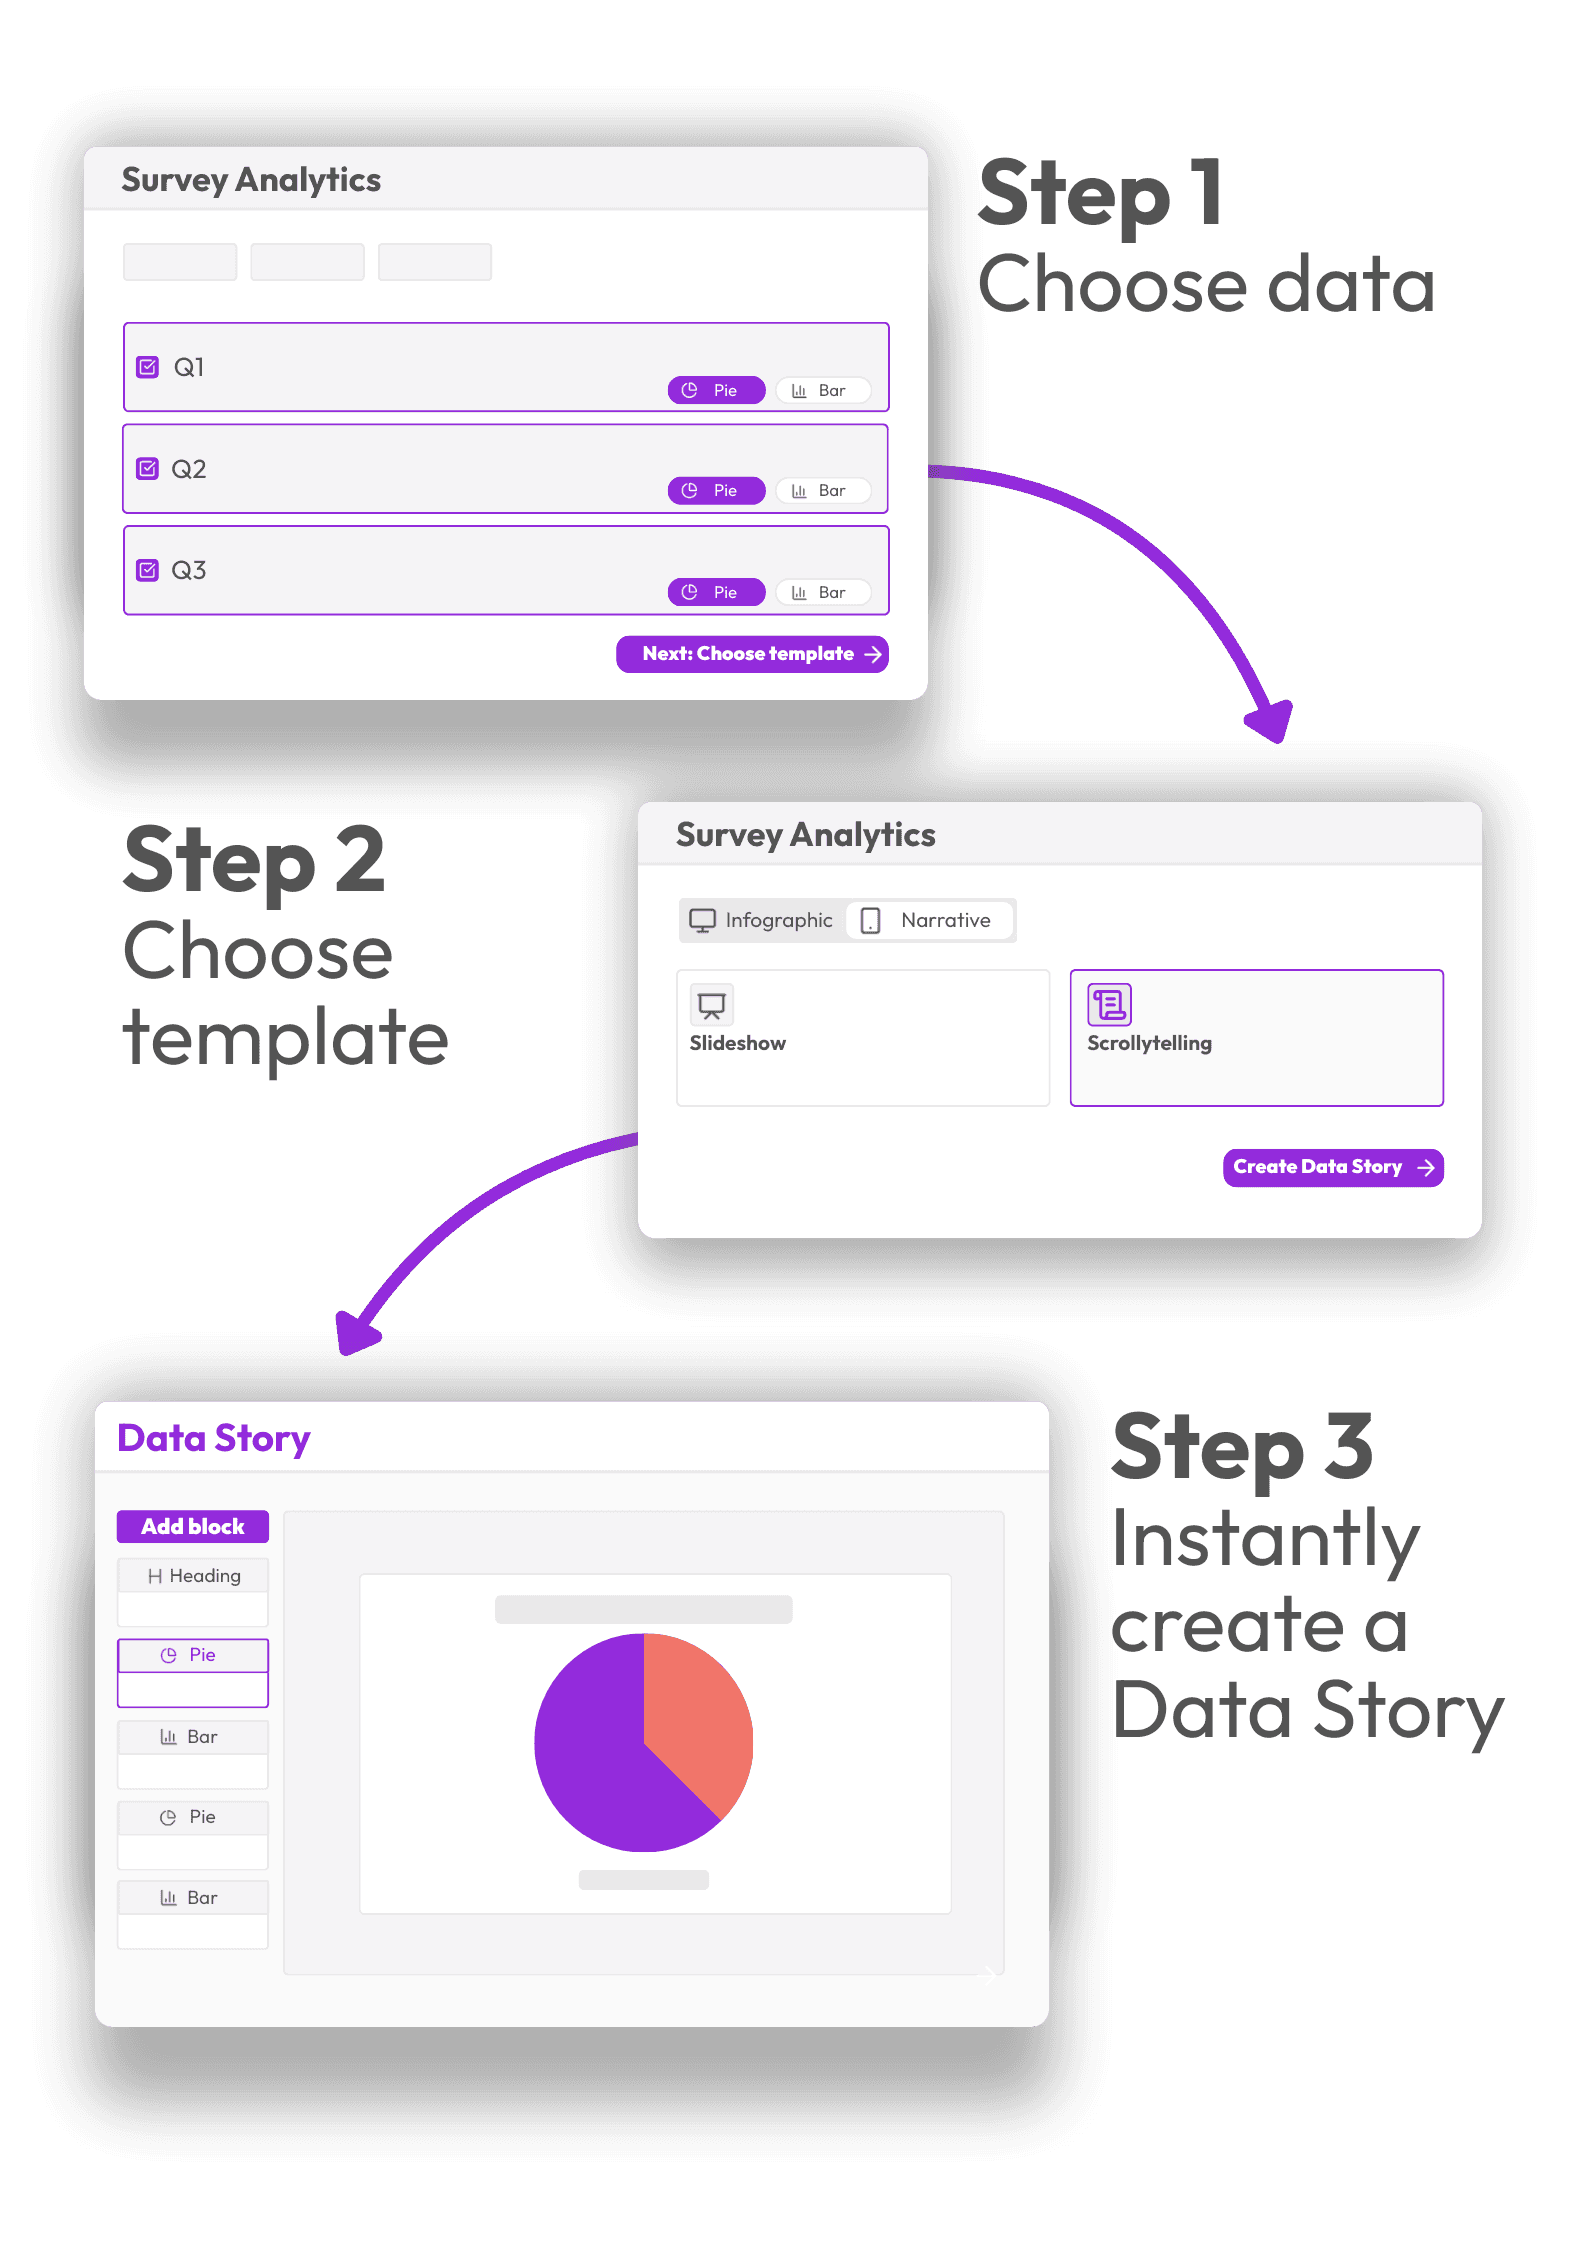
Making a Timepath Data Story is simple and effortless. Your newsroom can create interactive visuals without coding or design skills. Boost your workflow and bring data to life in minutes.
Top features for effortless data visualization
Discover how you can save time on visualization and focus on reporting the story that matters.
Streamline your workflow
Seamlessly pull your data directly from Timepath Survey without exporting or formatting. Everything is ready to visualize instantly. Save time and keep your workflow smooth while creating interactive data stories.
What chief editors say about Timepath
Timepath has elevated our editorial content to a whole new level. By bundling multiple ‘read also’ articles and presenting story series in a cohesive way, Timepath enables us to showcase chronological timelines not only in text, but also enriched with visuals and video.
 Sanne RiepemaPremium Specialist, DPG Media

Frequently Asked Questions
From timelines and liveblogs to quizzes, polls, and collections, find answers to the most common questions about creating, customizing, and publishing interactive content with Timepath.
